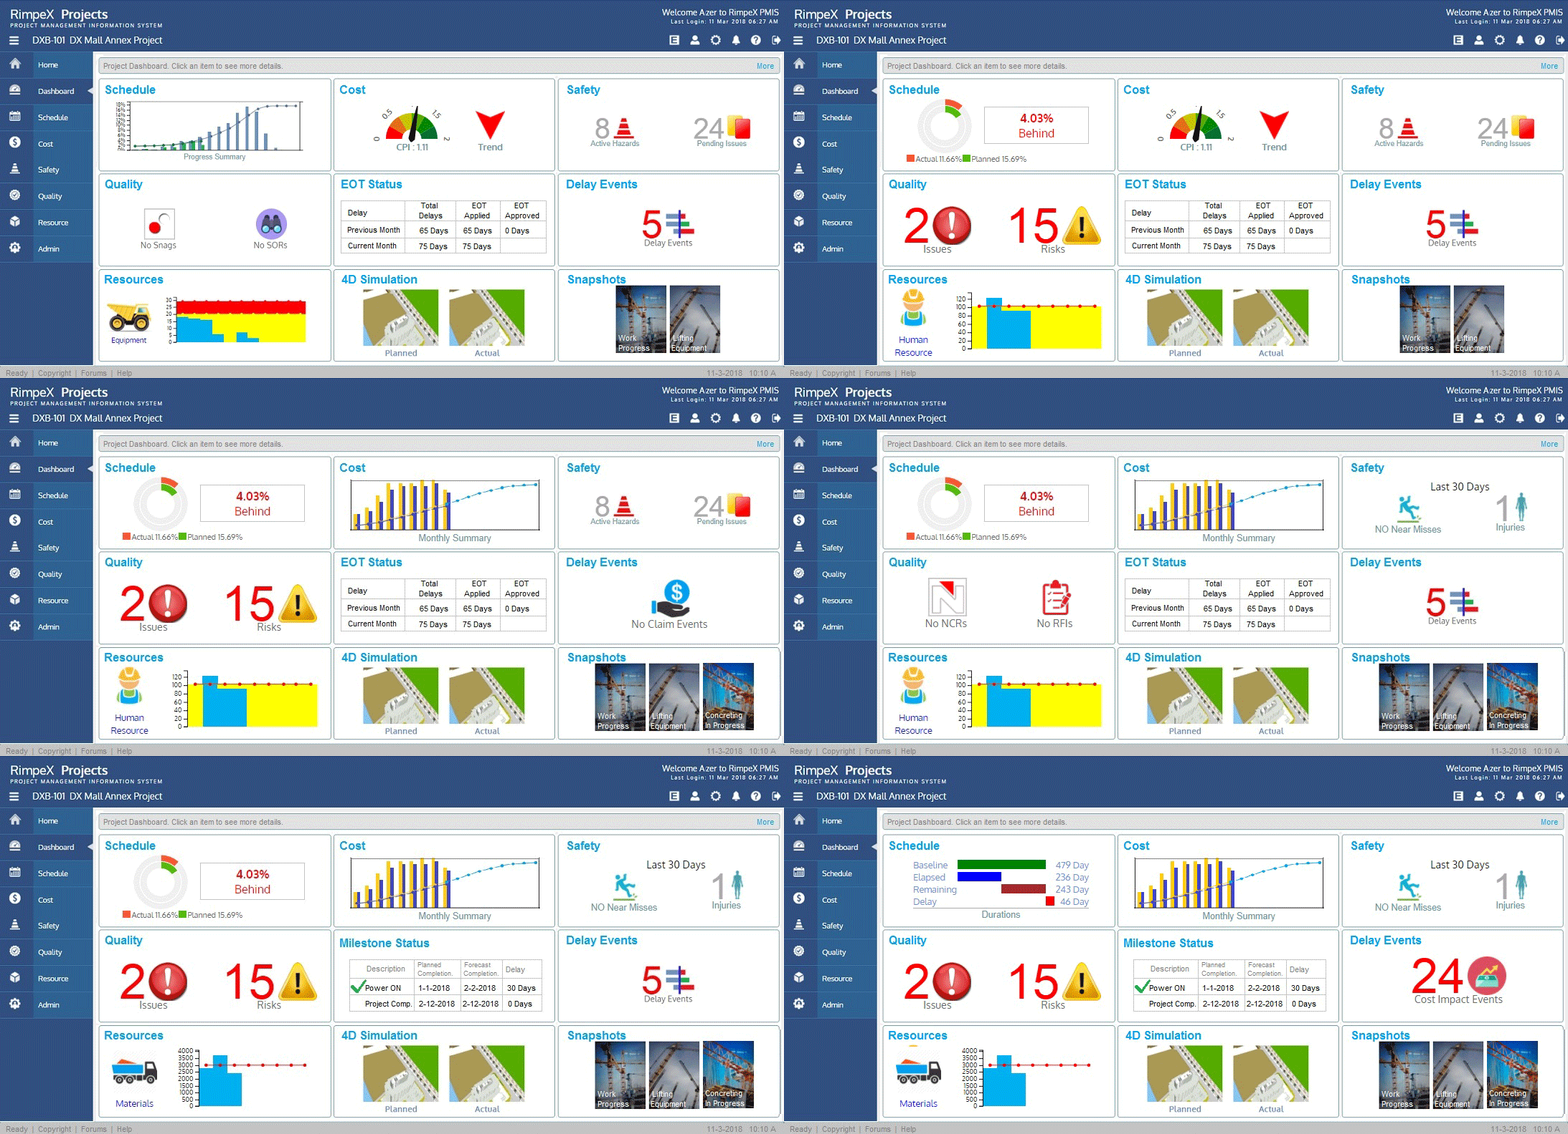
Project Dashboard
Project dashboard shows you the summaries of various sections in the project, KPIs, status of delays, costs, schedule, etc.

The project dashboard shows the summary and KPIs of the following:
Schedule : progress s-curve, summary of dates, summary of timeline and schedule performance index and current trend.
Cost: monthly cost summary, schedule performance index and current trend.
Safety: active hazards, pending issues, number of incidents, etc.
Quality: active non-conformances, site observations, risk, issues, request for information, snag, etc.
Delay: delay events and delays.
Claim: claim events and claim status.
Milestone: milestone status.
Extension of time: status of extension of time.
Resource: current status of manpower, equipment and materials.
4D Simulation: 3D view of actual progress and planned progress.
Recent progress photo: recent photographs with title.
Schedule impact: impact of current issues on the project schedule.
Risk level: average risk level and current risk level.
Cost impact: risk exposure on cost.
Primary cause: various primary causes and its percentages.
Functional workload: workload on different functions in the project.
Department workload: workload of various departments in the project.
Occurrence profile: occurrence profile of various activities in the project.
Site map: site with drawing and current activities on google maps.
Narrative summary: narrative summary of project and progress summaries.
Before you work with RimpeX Project Dashboard, please watch the following video.
